As our reliance on digital technology continues to grow, so does its impact on the planet. Every developer should know about their application's power consumption. They should make decisions based on the environmental impact of the possible design options. Green computing aims to reduce the environmental footprint of computing by focusing on energy-efficient hardware, reducing e-waste, and promoting software and system optimization that minimizes energy consumption. By adopting green computing practices, developers, can create sustainable solutions that not only improve performance but also contribute to a healthier planet.
In a previous blog post we've written about using the PowerAPI tool to measure the energy consumption of Java code. Since then, we've gained more knowledge and experience about the restrictions imposed by PowerAPI. This new knowledge has pushed us to look for a potential alternative. We are mainly looking for a solution that would work on multiple platforms, not just Linux. We are also looking for a tool that would work thru a VM and prevent the user from having access to the host hardware. Now, let's familiarise ourselves with JoularJx.
What is JoularJx
JoularJx is a software tool (a Java Agent) designed to provide developers with accurate insights into the power consumption of their applications. It can me used on x86 Linux, Mac, Windows or Raspberry Pi systems. JoularJx helps identify methods where power usage could be reduced. It will record the power consumption of each method of a Java program during the whole runtime. JoularJx is using the PowerJoular tool from the same authors, to either read the power consumption as reported directly by the x86 microprocessor's RAPL hardware or accurately estimate it when used on a Raspberry Pi. Both Joular tools are parts of the larger Joular Project directed by Dr Adel Noureddine.
What is the Running Average Power Limit (RAPL)
The Running Average Power Limit (RAPL) is a hardware feature designed by Intel to measure and limit the power consumption of its microprocessors and other system components, such as memory and the integrated graphics unit. This allows real-time management of power usage, which can prevent thermal throttling, overheating or unnecessary energy use. AMD also implemented a similar feature in their own CPUs.
Introduced with the Sandy Bridge generation (2011) of processors, the RAPL module contains counter registers that indicate the energy consumed since the processor was booted up. These counters are updated approximately once every millisecond. RAPL updates do not occur precisely every millisecond but does have some jitter. The energy is counted in multiples of model-specific energy units. Sandy Bridge uses energy units of 15.3 microjoules, whereas Haswell (2013) and Skylake (2015) uses units of 61 microjoules.
Researchers found that the RAPL sample rate is sufficient to distinguish different execution phases in applications. Their experiment shows that for Haswell most of the update happen at a time gap of nearly 1000 µs whereas for Skylake the bulk of the updates happen between 50 and 70 µs. The researchers discovered that it is not possible to increase the sampling rate. They suggest a solution to measure a method that is shorter than the update period. Is to force the application to sleep a known amount of time before and after the execution of that method. Per their findings, prior to Haswell, RAPL was not very consistent or reliable. They also pointed out that the RAPL updates have no timestamps, which can lead to inaccuracy when sampling the counters.
One important caveat of RAPL is that it only gives the total energy consumed by all cores in a single package. This prevents from separating the power consumption of different processes or threads running concurrently on the same processor. However, it is possible to examine the power consumption of individual threads by running an application in single-threaded mode.
What is a Java Agent
Java agents are tools that allow developers to instrument or monitor the behavior of a Java application at runtime. These agents work by using the Instrumentation API introduced in the JDK 1.5.
Instrumentation can be described as the addition of bytecodes to methods for the purpose of gathering data to be utilized by tools. Because the changes are purely additive, these tools do not modify the application state or behavior.
The Instrumentation API is a part of the java.lang.instrument package. It provides hooks to intercept class loading by the JVM and allows the agent to modify the bytecode of these classes beforehand. Also, this could potentially be done on a running JVM with already loaded classes using Java’s Attach API. A newly loaded agent could trigger a reload of a modified class.
A Java agent is a special type of Java program that can be attached to a JVM at either startup or during runtime. Another way to describe it is that a Java agent is just a specially crafted .jar file.
This mechanism is mainly used to create profilers or event loggers without having to modifying the original source code. In our case, this is what allows JoularJx to record the power consumption of every method in a Java application.
Experimenting with JoularJx
As a test bench we used a Lenovo Laptop sporting an Intel Core i5-4200M (Haswell). Operating system used was Windows 10 Pro version 22H2. The JVM was Java Hotspot v17.0.10 64bit.
First, the Hubblo Windows RAPL driver needs to be installed. Both DriverLoader.exe and ScaphandreDrv.sys files are required. Installation instructions are short and simple. They are provided in the readme file.
Second, Joular/WinPowerMonitor's PowerMonitor.exe must be downloaded and saved where JoularJx Java agent can access it.
Third, both the joularjx-xxx.jar and config.properties files must be downloaded from JoularJx. Those files must be saved where the Java JVM is going to be invoked.
Fourth, the config.properties file will need to be edited. The line starting with "powermonitor-path" needs to provide the path where the WinPowerMonitor .exe is located. Like the example below.
powermonitor-path=C:\Users\UserX\Downloads\scaphandre\PowerMonitor.exe
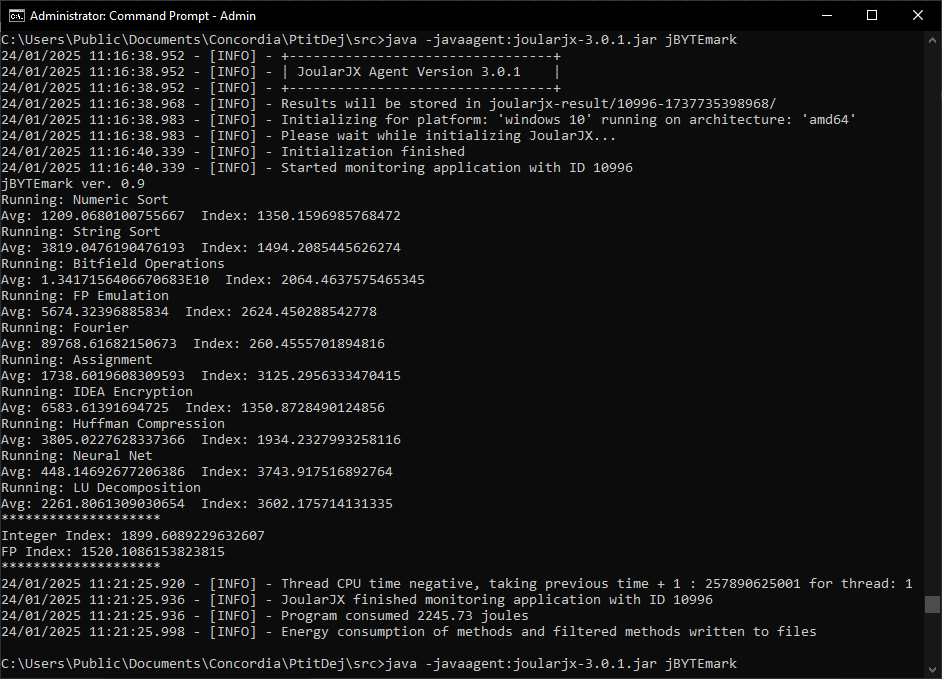
Then, JoularJx's agent can be invoked when starting the JVM, as shown here:
java -javaagent:joularjx-3.0.1.jar jBYTEmark
We used the Java JVM benchmark jBYTEmark as a workload. That benchmark was created by the now defunct Byte computer magazine based on their original BYTEmark benchmark done in C. The baseline index result of 1.0 is equivalent to the original Sun's JVM ran on a Pentium 90 MHz in 1996.
What we found out is that the result can be inconsistent (+/- 5%). From our observations, this seems to be mainly due to the overall system load not just the program under test. We were able to improve the consistency by starting the JVM using different options (-Xint or -XX:ActiveProcessorCount=1) at the cost of much longer run times. We advice to run the tests multiple times to be able to detect unusual results. We also discovered that running JoularJx could have a significant performance cost, up to 8% decrease in the benchmark index results.
JoularJX Reader GUI
JoularJx Reader GUI is a separate tool from JoularJx that allows to easily visualise the data collected during the program under test runtime.
To use it, the source code needs to be retrieved from here: JoularJx Reader GUI.
The tool looks like it's still under development. There's little information provided by the author(s). No binary is provided. The tools will only run under the Windows operating system. To generate a binary, Microsoft Visual Studio is required for compilation. We used VS Community Edition 2022 Version 17.12.3 with the .NET SDK version 4.8.09037. The author(s) provide a VS solution package. To build the tool, only a single click is required.
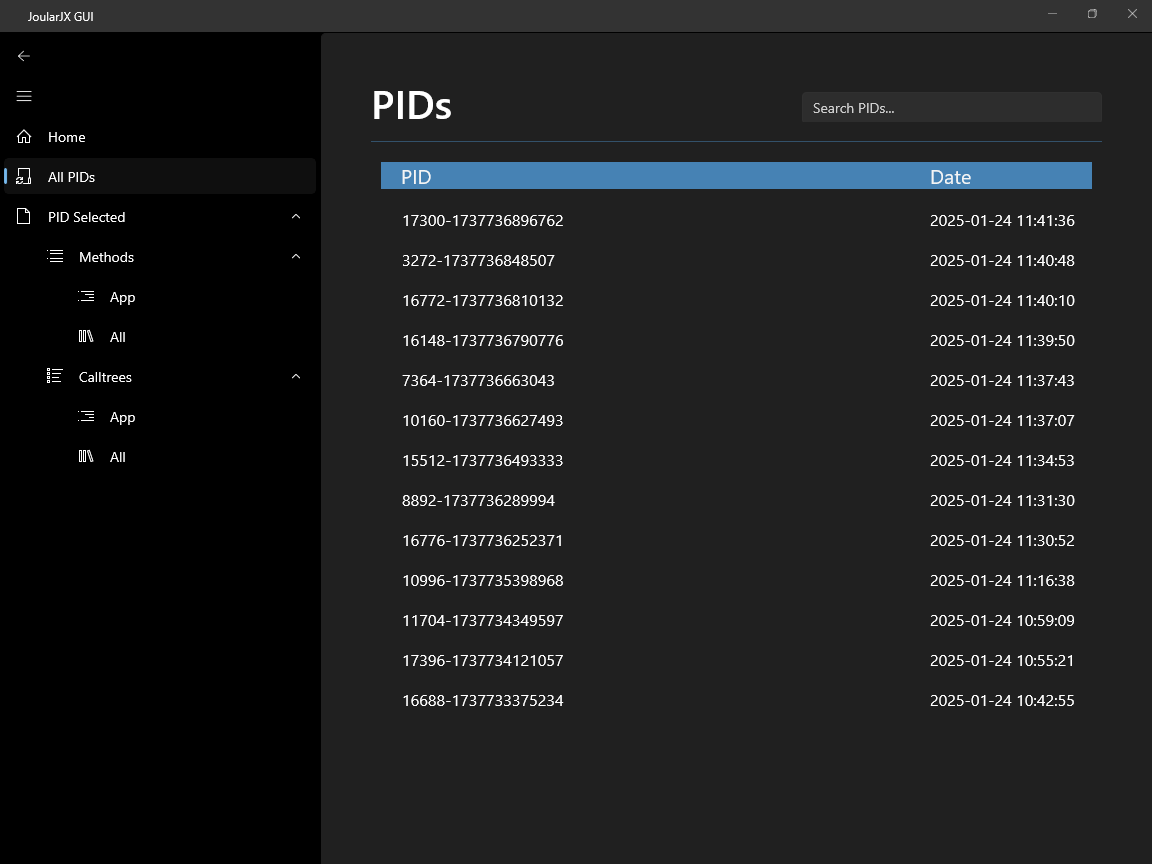
Once compiled, start JoularJx Reader. The application home screen will ask for a result folder. Select the /joularjx-result/ folder created by JoularJx where the program under test was run.
We found that the application is easy to use, and the control are intuitive. However, we encounter at least one crash, nothing serious. We had to restart the tool and could continue with our analysis. No data was lost.
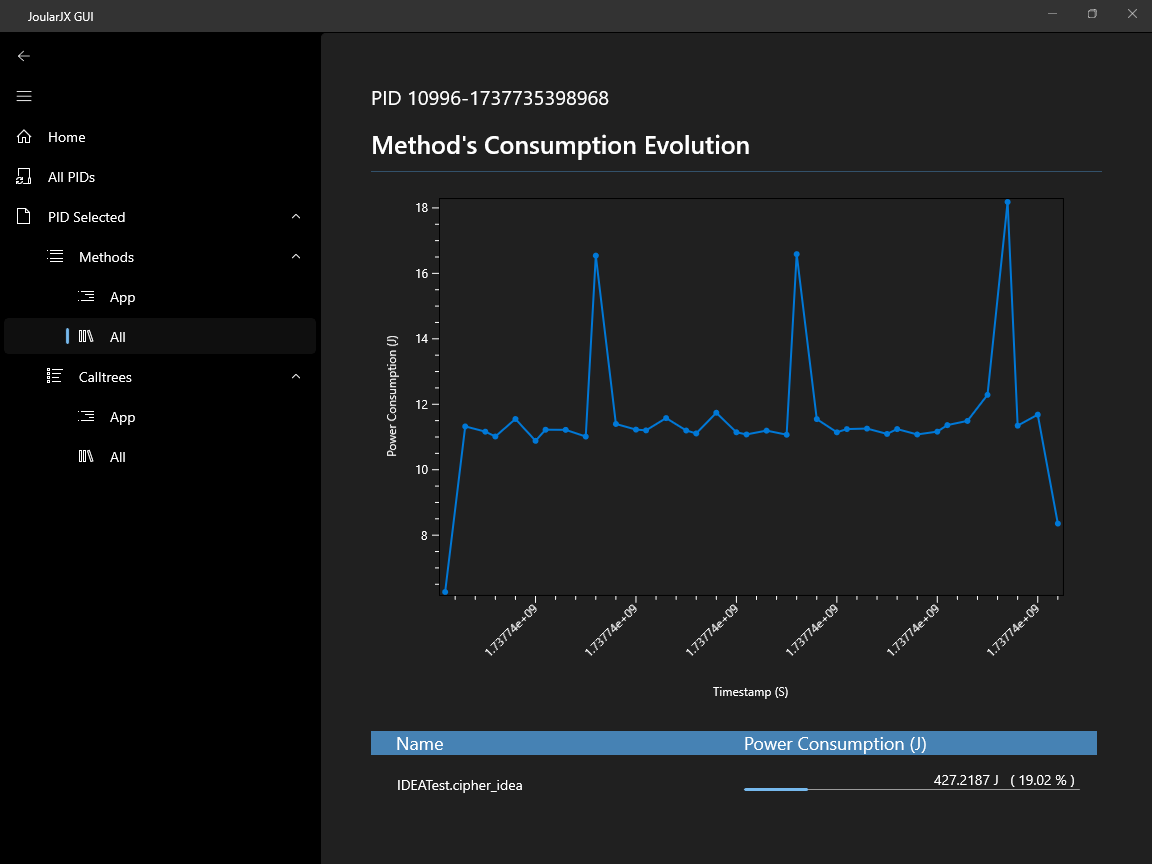
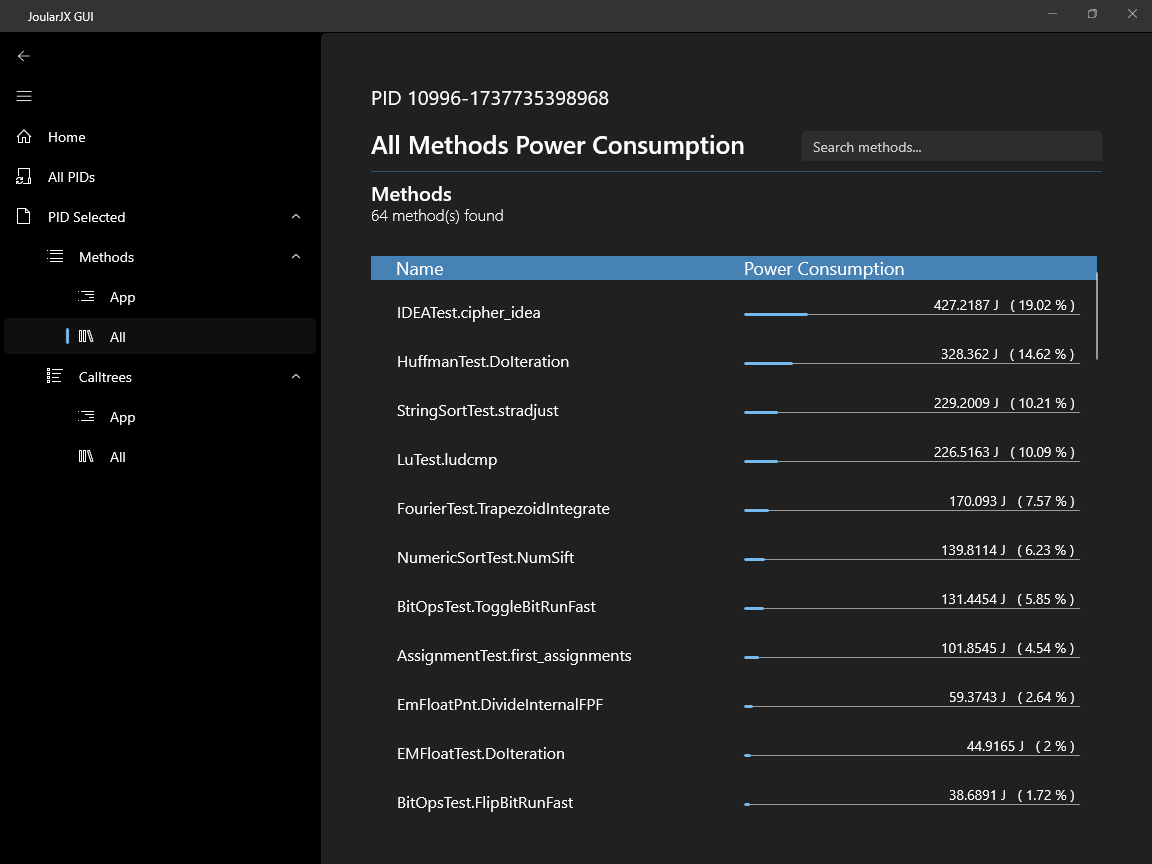
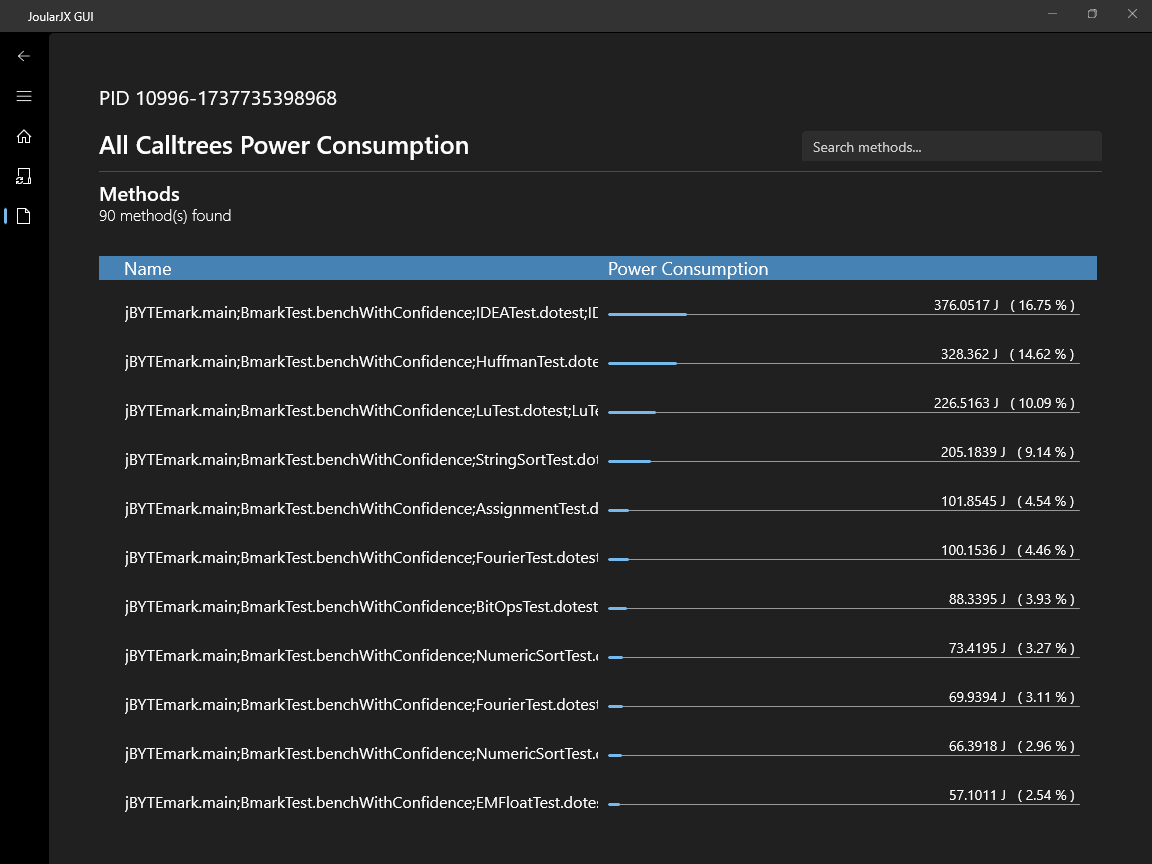
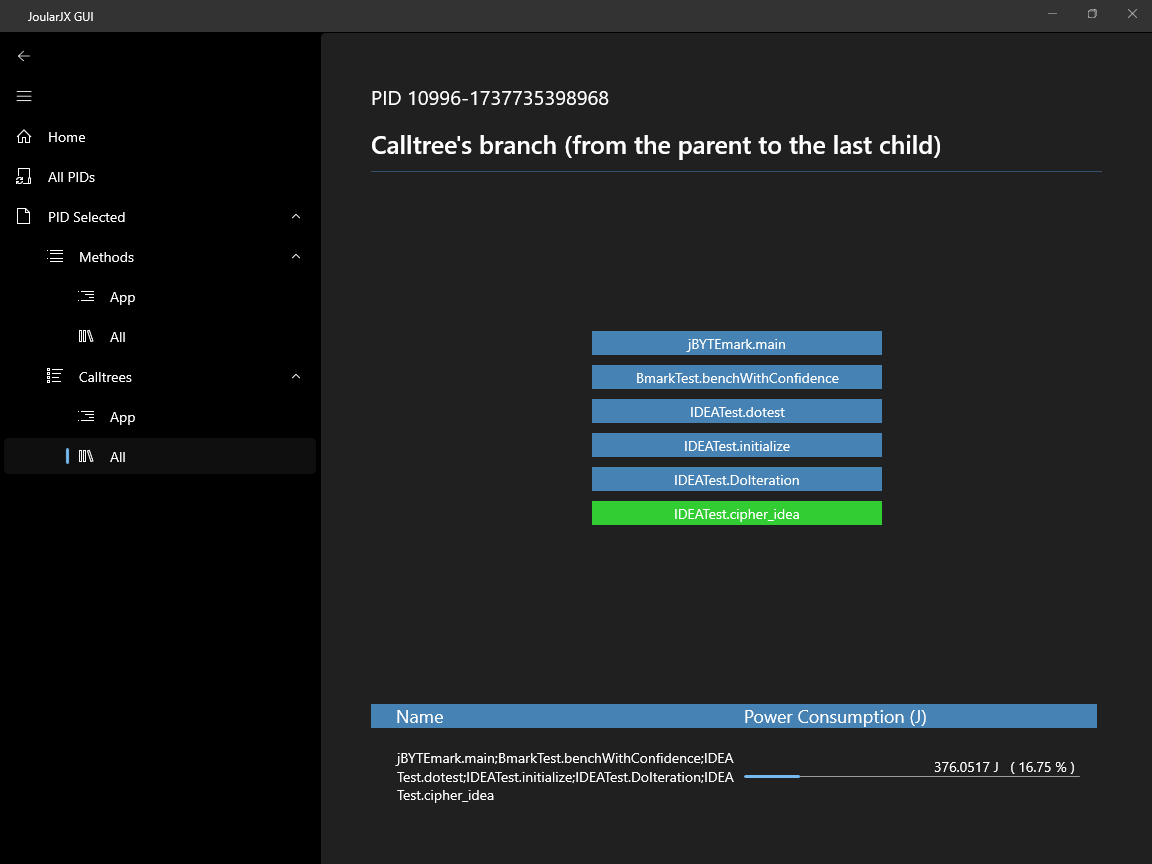
Shown below are snapshot of the various screens used to navigate and visualise the collected data for each run of the program under test.
In the future, we would like to test JoularJx capability of monitoring the power consumption of a process running inside a virtual machine. This is not normally possible because the RAPL registers can't be accessed from the guest operating system on the host machine. We would also like to test JoularJx under the Linux OS.
To sum it up, JoularJx has shown to be a good alternative to PowerAPI. Some of the advantages over it are: it can run under multiple OS including Windows, it's simpler to use as no source code needs to be modified and, it give detailed information of the power consumption during the whole runtime of the examined process.