During my bachelor's, I picked up Albert-László Barabási's Network Science book for a research project. The premise is elegant: protein interactions, power grids, social media feeds, financial markets, and many other complex systems can be modeled as graphs, with objects as nodes and relationships as edges. Once you have a graph, you can measure things: who is central, what clusters form, how fast information spreads, and whether the network has the "small-world" property where any two nodes are surprisingly close [1].
Scientific collaboration networks fell into this framework naturally and captivated me. I wanted to apply these ideas to Brazilian computer science to answer some questions that I had out of curiosity. The result is a peer-reviewed paper, Beyond Boundaries: Collaboration Networks and Research Output in Brazilian Computer Science, co-authored with André Vignatti, published in the XIV Brazilian Workshop on Social Network Analysis and Mining (BraSNAM) [2]. This post is my attempt to bring the findings out of LaTeX and into plain language, while adding some context about the research.
The Science of Measuring Science
Before the methodology, some framing. Bibliometrics is the quantitative study of scientific publications: how many papers are produced, who cites whom, how journals and conferences vary in prestige, and how those numbers change over time. A related but broader field, scientometrics, studies science itself as a social and epistemic system, asking how institutions, funding, geography, and policy shape what knowledge gets produced and by whom [3].
These fields have exploded in the last two decades, partly because open bibliometric databases made large-scale analysis feasible, and partly because funding agencies started using bibliometric indicators in evaluation processes. In Brazil, CAPES (which accredits graduate programs) and CNPq (the main research funding agency) both rely on metrics such as publication counts, citation rates, and collaboration breadth to assess researchers and programs.
Instead of counting papers and citations in isolation, Social Network Analysis (SNA) lets you ask structural questions: is this research community tightly clustered or spread out? Who are the "bridge" researchers connecting otherwise separate groups? How much does the network depend on a handful of key connectors? These questions cannot be answered by looking at individual papers; they require treating the entire community as a system.
Data Collection
There are a few options to collect publication metadata, some of them are open solutions like DBLP, Semantic Scholar, and OpenAlex, and also some commercial tools such as Scopus and Web of Science. All of these options enable us to access the publication metadata through API requests.
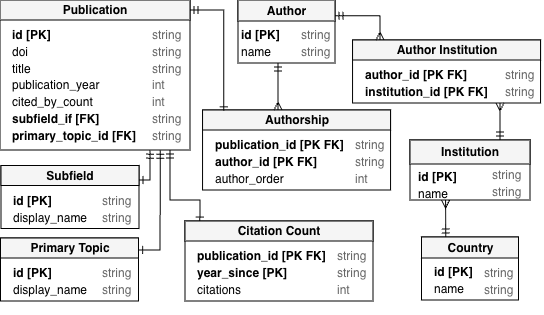
We decided to use OpenAlex for two main reasons. First, it has a detailed level of metadata, providing all the information we needed. For instance, it has institutional affiliations of the authors that support geographical analysis and systematic classification of publications within disciplinary subfields. Second, it offers great API documentation, especially when compared to other data sources, where the API data itself and the documentation are very confusing. Overall, OpenAlex is very easy to use, and the data we collected follows this structure:
We collected all data on March 31, 2025, and stored the raw dataset in CSV. The pipeline followed a classic ETL (Extract, Transform, Load) pattern:
- Extract: Python scripts queried the OpenAlex API in batches of 25 records, organized by subfield and country to handle pagination constraints.
- Transform: We cleaned duplicates (using DOIs and OpenAlex IDs as keys), removed entries without DOIs, and built co-authorship graphs using NetworkX. Edges were weighted by collaboration frequency and graphs were exported as GEXF files.
- Load: Statistical visualizations were produced with Seaborn and network visualizations with Gephi.
All code and datasets are publicly available on our GitHub repository.
Global Landscape
Brazil ranks 12th globally in publication output with 76,184 publications and 447,919 citations. This positions Brazil in the middle tier of global research productivity, yet Brazil's citation ratio of 5.88 falls considerably short of high-impact nations like Australia, Great Britain, and the United States.
| Rank | Country | Publications | Citations | Citations/Paper |
|---|---|---|---|---|
| 1 | 🇨🇳 China | 694,103 | 8,280,834 | 11.93 |
| 2 | 🇺🇸 United States | 474,474 | 9,590,230 | 20.21 |
| 3 | 🇮🇳 India | 311,644 | 2,224,750 | 7.14 |
| 4 | 🇮🇩 Indonesia | 266,047 | 755,078 | 2.84 |
| 5 | 🇩🇪 Germany | 141,044 | 1,960,782 | 13.90 |
| 6 | 🇬🇧 Great Britain | 140,019 | 3,026,576 | 21.62 |
| 7 | 🇯🇵 Japan | 103,265 | 799,048 | 7.74 |
| 8 | 🇫🇷 France | 92,131 | 1,011,787 | 10.98 |
| 9 | 🇨🇦 Canada | 84,076 | 1,562,176 | 18.58 |
| 10 | 🇷🇺 Russian Federation | 83,214 | 363,210 | 4.36 |
| 11 | 🇮🇹 Italy | 80,647 | 1,021,944 | 12.67 |
| 12 | 🇧🇷 Brazil | 76,184 | 447,919 | 5.88 |
| 13 | 🇪🇸 Spain | 75,433 | 944,337 | 12.52 |
| 14 | 🇰🇷 South Korea | 74,421 | 994,882 | 13.37 |
| 15 | 🇦🇺 Australia | 68,502 | 1,561,906 | 22.80 |
Many factors influence how often a scientific publication is cited, including the quality of the research, the field of study, the publication venue, and the language. These factors are extensively studied in Bibliometrics and Scientometrics [3], but they are not the focus of our work. Instead, we investigate international scientific collaboration between Brazilian researchers.
International Collaboration Levels
To examine the level of international collaborations for each Computer Science subfield, we classified each publication as domestic (all authors at Brazilian institutions) or international (at least one co-author at a foreign institution).
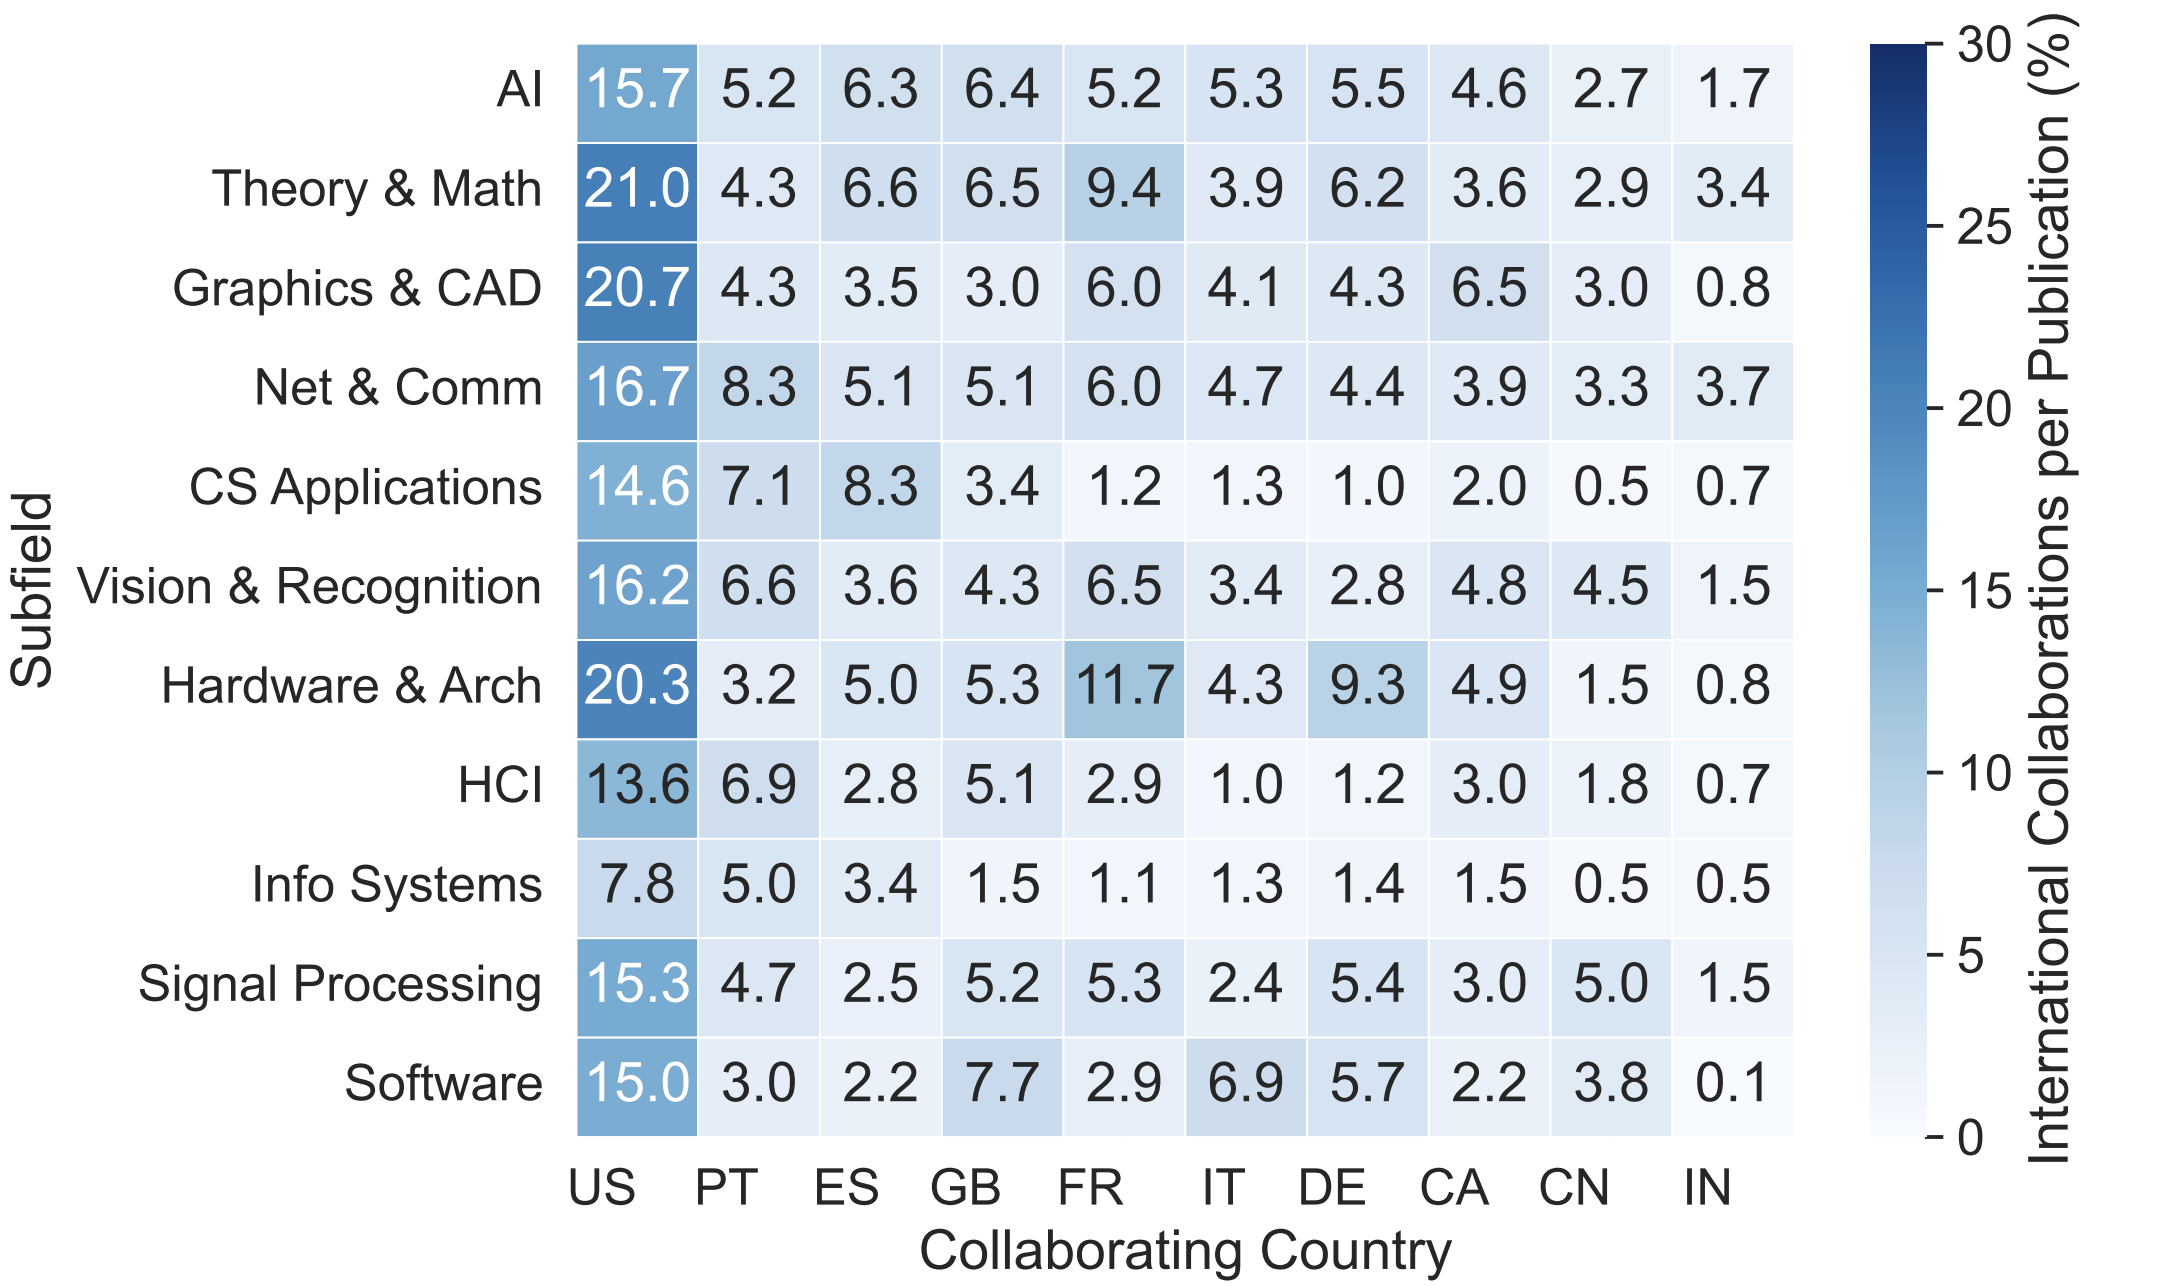
We investigate the rate of international publications for each Computer Science subfield. It turns out that the proportion varies significantly. Theory & Math leads international collaboration (37%), while Info Systems lags (16%).
| Subfield | Domestic-only Pub. | Domestic-only % | International Pub. | International % |
|---|---|---|---|---|
| Theory & Math | 2,471 | 62.54 | 1,480 | 37.46 |
| Networks & Comm | 5,309 | 67.34 | 2,575 | 32.66 |
| Graphics & CAD | 251 | 68.21 | 117 | 31.79 |
| Hardware & Arch | 811 | 69.38 | 358 | 30.62 |
| AI | 10,009 | 70.68 | 4,152 | 29.32 |
| Vision & Recognition | 4,470 | 71.93 | 1,744 | 28.07 |
| Signal Processing | 1,543 | 72.20 | 594 | 27.80 |
| Software | 583 | 72.24 | 224 | 27.76 |
| CS Apps | 2,260 | 74.69 | 766 | 25.31 |
| HCI | 1,443 | 78.42 | 397 | 21.58 |
| Info Systems | 22,135 | 83.26 | 4,450 | 16.74 |
| Total | 51,285 | 75.26 | 16,857 | 24.74 |
The United States is the primary collaborator of Brazil across all subfields. Portugal emerges as the second most significant collaborator, likely facilitated by shared linguistic and cultural ties. Other European countries, such as Spain, Germany, and France, exhibit specialized collaborations.
Our analysis also showed that papers involving international collaboration receive substantially more citations than domestic-only papers, with an average of 12.56 citations per paper compared to 3.95. Furthermore, international collaboration papers exhibited a considerably lower zero-citation rate: only 29% remained uncited, whereas 49% of domestic-only papers received no citations.
Network Structure and Dynamics
The full network, encompassing all publications, has 119,228 nodes (N) and 465,163 edges (E), with a fragmentation (F) of 0.64, the average clustering coefficient (C) of 0.79, and the with 76,770 Nodes in the Largest Component (NLC). This suggests a relatively connected network with a high propensity for collaborators of an author to also be collaborators with each other.
| Network | Pub. | N | E | F | C | NLC |
|---|---|---|---|---|---|---|
| Info Systems | 26,585 | 65,349 | 196,087 | 0.83 | 0.80 | 26,543 |
| AI | 14,161 | 28,636 | 119,515 | 0.64 | 0.77 | 17,211 |
| Net & Comm | 7,884 | 14,701 | 48,756 | 0.64 | 0.78 | 8,763 |
| Vision & Recognition | 6,214 | 13,776 | 49,678 | 0.69 | 0.82 | 7,641 |
| Theory & Math | 3,951 | 8,568 | 46,513 | 0.87 | 0.80 | 3,132 |
| CS Apps | 3,026 | 7,023 | 17,872 | 0.85 | 0.78 | 2,705 |
| Signal Processing | 2,137 | 4,399 | 13,340 | 0.89 | 0.82 | 1,409 |
| HCI | 1,840 | 4,516 | 12,116 | 0.93 | 0.78 | 1,174 |
| Hardware & Arch | 1,169 | 2,276 | 7,084 | 0.65 | 0.83 | 1,345 |
| Software | 807 | 1,736 | 4,221 | 0.86 | 0.80 | 630 |
| Graphics & CAD | 368 | 925 | 1,709 | 0.98 | 0.79 | 105 |
| Full network | 68,142 | 128,847 | 492,524 | 0.64 | 0.78 | 76,770 |
Visualizing this type of network is challenging because the large number of nodes and edges leads to heavily cluttered representations, which reduces interpretability. So we generated a series of network visualizations focusing on two aspects of the collaboration structure: highly cited publications (those with more than 40 citations) and recurrent co-authorship relationships. The analysis considered both country-level and subfield-level collaboration networks. The filtered network has 1,063 nodes and 2,237 edges.
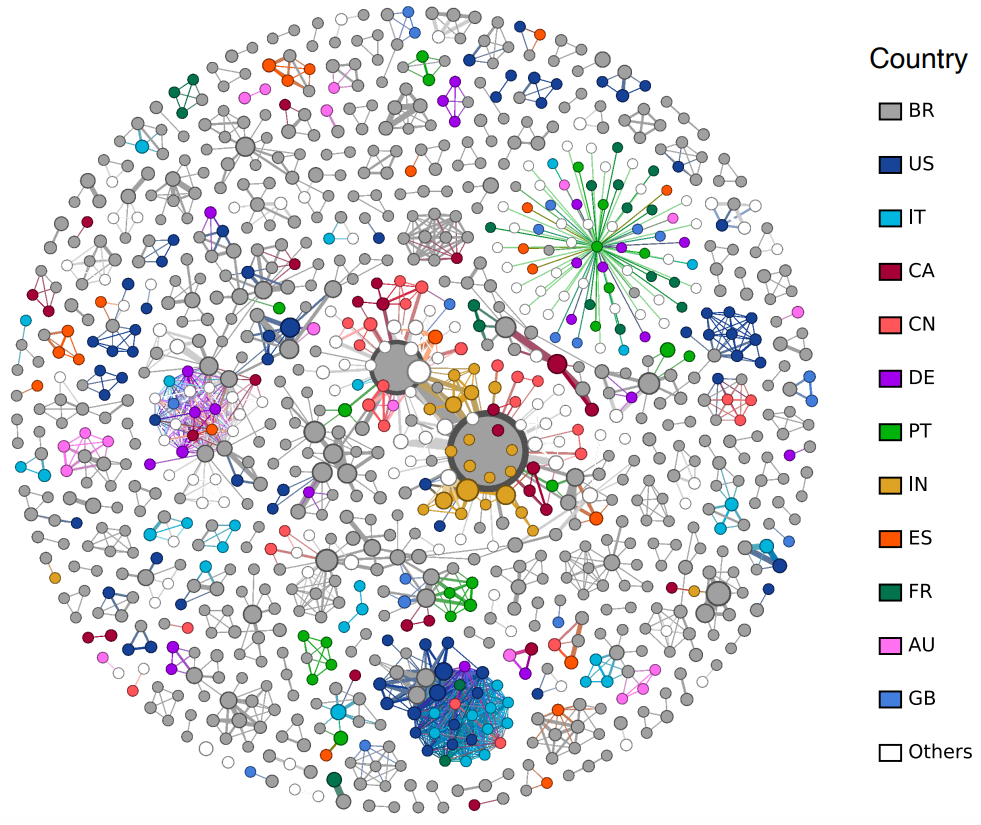
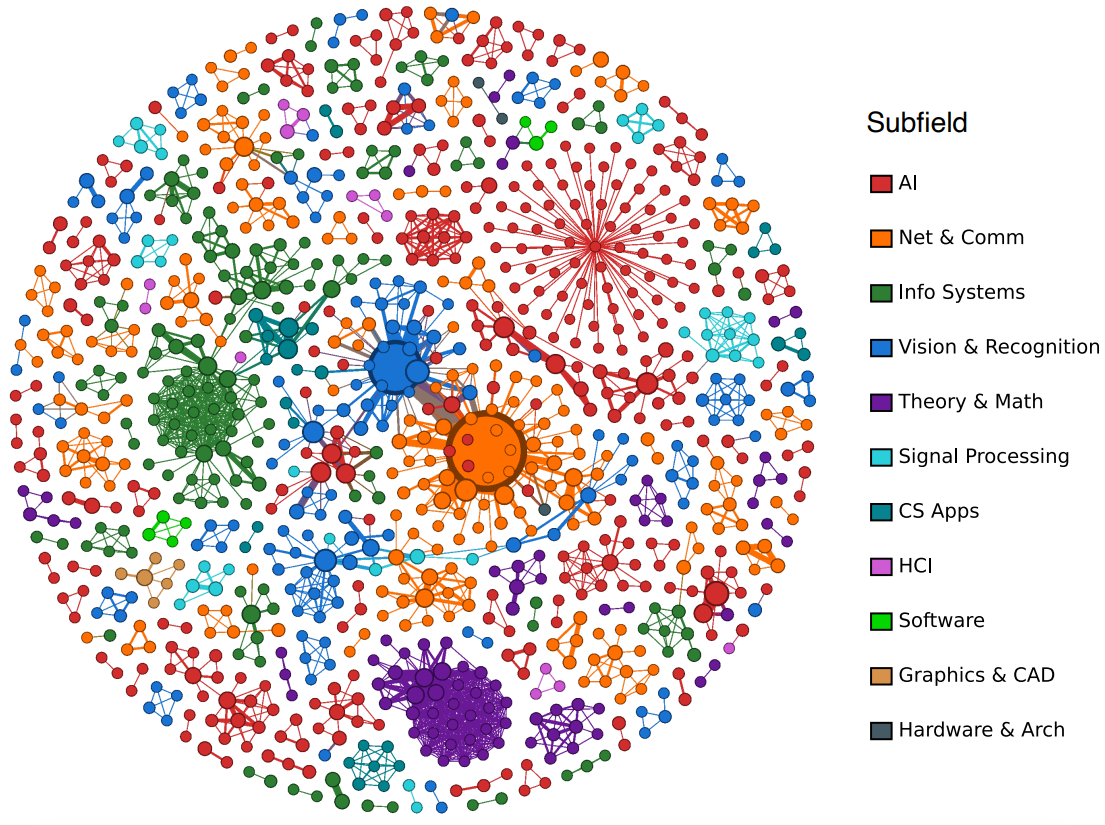
We note that in highly cited publications, Brazilian authors form central hubs, and international authors are not evenly distributed over the network, suggesting that international partnerships concentrate around a few key researchers. In addition to that, cross-disciplinary edges exist but largely rely on a handful of “bridge” research.
Discussion
It is very interesting to see how collaboration varies within Computer Science subfields, and this gives us more context for understanding some of the reasons for research impact. Still, there are many other angles to explore. For instance, using another data source (Scopus, Semantic Scholar, Web of Science) would be great to improve data coverage and quality. Another thing that would help us to understand the collaboration dynamics is to compare Brazilian collaboration networks with those of other countries. For example, Canada, France, and Italy have a similar number of publications, so a few questions could be made: how do these countries’ collaboration networks look? Which are the countries they collaborate with the most? How does the citation disparity differ for each subfield in those countries?
[1] https://networksciencebook.com/
[2] https://sol.sbc.org.br/index.php/brasnam/article/view/36367
[3] https://researchmusings.substack.com/p/scientometrics-or-bibliometrics
[4] https://link.springer.com/article/10.1023/A:1017919924342